The THD Data Nerds Take an Attribution Novice for a Trip Down the Yellow Brick Road
I’ve been working in the field of nonprofit fundraising for north of a decade now, so I’ve been around the block a few times. Even still, I keep getting hung up on something, something that everyone’s talking about. It’s a perennial thorn in my side, year after year. And that thorn is called attribution.
Don’t get me wrong, I get the concept. It’s about accurately assigning, or attributing, the value of a specific marketing touchpoint in a series of touchpoints that leads to a user taking an action, or converting. How to use it, how to put attribution into action — that’s my stumbling block.
I bet there are other people out there like me who are familiar with the concept of attribution but aren’t quite sure where to begin. We buy the logic behind attribution, we’re fully subscribed, but we’re not sure how to put attribution into practice to improve the accuracy and effectiveness of how we evaluate our marketing efforts. (Can anyone out there identify??)
Thankfully, here at THD, I’m surrounded by a cadre of smart folks who we affectionately call “the THD data nerds.” So, I took my quandary to a couple of them: Francis Skipper, SVP of Strategy, and Chris Canaway, Sr. Director of Marketing Analytics.
What follows is my interview with Francis and Chris, two data wizards who were willing to indulge my one-man crusade to demystify attribution and dislodge this pesky thorn from my side once and for all.
Jamie: To get us started, can you give me a quick recap of what attribution is? There are some leftover cobwebs in my brain (holdouts, I guess, from a pandemic-era 2020 Halloween that never was).
Francis: Attribution is about properly crediting a marketing touchpoint’s influence on a user’s behavior. For example, before a donor makes a gift, they may see a PPC ad from your organization, click through to a blog post from a cultivation email, follow an organic search link, all before visiting your site by typing in the URL and (finally!) making a gift. Each impression along the way likely contributed to influencing the donor’s choice to make a gift in the end. Attribution is about giving due credit to each and every one of those different impressions or touchpoints. Now, there are many different ways of assigning credit, and that’s where different attribution models come in. Check out my latest blog post for a rundown of the different types of attribution models.
Jamie: Alright, that helps — cobwebs cleared. I feel like attribution has become a ubiquitous buzzword in our field (am I right???). Why are so many fundraisers engaged in the conversation around attribution right now?
Francis: Because correctly attributing credit to your marketing efforts is essential to optimizing performance and reducing waste. As people have been spending more and more time on various online channels using multiple screens and devices, the donor journey has gotten pretty convoluted, leaving us marketers struggling to find a reliable method for measuring activity across media channels. When done right, attribution is the key to unlocking the mysteries of today’s circuitous donor journey and generating more revenue from your marketing efforts. So, there’s something there… it’s more than just buzz.
Jamie: So, it sounds like using an attribution model when evaluating marketing performance is indispensable in this day and age. Can you give me an example of what could go wrong when you don’t apply an attribution model in results analysis?
Francis: Sure thing. One of the main problems is using the default attribution method that most web analytics software uses — and that’s last click. Using only the last touchpoint of a donor’s conversion pathway doesn’t show you any of the activity (paid, earned, or otherwise) that happened before that conversion. So, you’re blind to the factors that led to that donation, sign up, or lead capture. And when real money is involved, we never want to go in blind.
Jamie: Okay, now that we’re grounded in what attribution is and why it’s important, can you answer what should be a simple question: How do I turn attribution on? In other words, what does it take to implement an attribution model? It’s just like flipping a switch, right?? Or perhaps it’s not so simple…
Francis: It’s pretty easy with free tools like Google Analytics (GA). You just have to know where to look. By default, GA uses a type of last click called last non-direct interaction, which in some ways is worse than last-click. We can save that for another interview (haha). However, within GA, if you drill down to multichannel funnels (in the conversions tabs) you’ll start to see the effect “assisting” channels have on the final conversion. Two great views within multichannel funnels are assisted conversions and top paths. I’d definitely give those a look.
Chris: At THD, we take a multifaceted approach to attribution for our clients, including digital and offline media. As Francis mentioned, we tackle digital attribution with a variety of models, including unique linear attribution. We combine that with modern media mix models to understand the influences offline and digital have on each other. One of the features that make us unique is that we bring it all together into our own data hub so our clients can view it in one place.
Jamie: Francis, as you mentioned above, you gave us a quick roundup of all the different attribution models that are out there in your last blog post. What if I’m accustomed to using first-click or last-click attribution, for example… how do I bridge the gap to more sophisticated models like linear attribution?
Francis: The first thing to do is (take a breath and) realize that there are alternative ways to look at your data. Using the model comparison tool in GA is a great way to play “what if”. When you can see up to three models side by side, it’s hard to miss the shortcomings of a 1-interaction attribution model. From there, it’s some trial and error to see what the best fit is for your organization.
Jamie: Okay, so say I take the plunge, linear attribution is all set up now — how will my data look different and what does it mean?
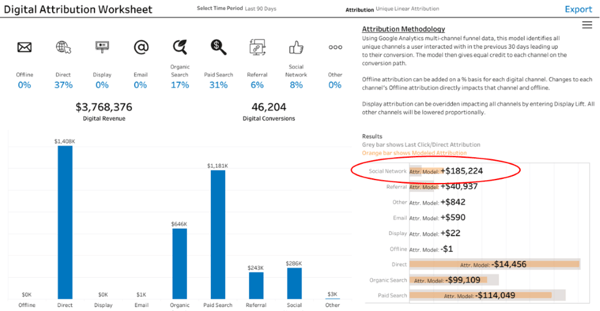
Chris: Linear attribution will help you understand ROI from all channels on the conversion path. Consider this example… a prospect researching your mission clicks through a search link. Then, the prospect is getting to know you on social media, and they click to learn more on your website. Next, they click through a banner ad and donate. Linear attribution will ensure the influence of all channels is measured and not just the last click. We discovered one client that had undervalued social media by 68% by only looking at last click. The following image from one of our THD lens dashboards (more on that below!) shows attributed revenue from different sources. Without applying an attribution model, you may have missed that social media was driving a significant number of gifts.

Figure 1. This view from the THD lens Digital Attribution Worksheet reveals revenue and conversions from different sources when applying a linear attribution model. Without the benefit of attribution, revenue share from different sources looks very different.
Jamie: So, I get that Google Analytics has a lot of functionality and offers many different ways of looking at my data. But I’ve got a lot on my plate, and going down the GA rabbit hole remains a little intimidating for me (it’s dark down there).
Chris: I understand. While GA is a great application to dig in to find insights, it can be quite time consuming for marketers. Luckily, at THD, we have brought our data nerds together to put some of the most important insights right at your fingertips with THD lens, our interactive dashboard portal. We have built custom APIs to bring GA data into our data hub, where we can join it with CRM and 3rd-party data. And as you probably expected, we incorporate our attribution knowledge throughout our digital marketing suite. Through THD lens, our clients can easily switch between last-click and unique linear attribution to understand the changes to ROI by channel.
Jamie: That’s way cool. And I swear they didn’t pay me to say that. What else can you do with THD lens?
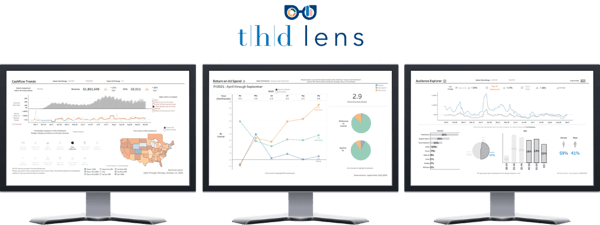
Chris: THD lens is a comprehensive portal of dashboards that helps marketers dig into their data. There are “KPI Dashboards” that summarize trends about key marketing audiences, origin channels, and life-cycle segments. There is an awesome “Cashflow Trends” dashboard that analyzes revenue trends by day, channel, and state, alongside 3rd-party data about website sessions, COVID-19 trends, and stock market changes. And last but certainly not least, THD lens has a suite of digital marketing dashboards that help marketers understand ROI and ROAS by channel, uncover hidden demographic trends, analyze site content by a variety of marketing segments, as well as develop audiences and build profiles with one click. And perhaps most important, I have been told the dashboards are easy to use, visual, and insightful.
Figure 2. The above image shows several different views that are available to users through the THD lens suite of interactive, business intelligence dashboards.
Jamie: Because aesthetics matter. And so does the name… we call it lens because our dashboards let you see things differently, more clearly — they help you see the metrics that matter. Now that folks have had a peek behind the curtain (and our data nerds are the real deal, unlike that imposter from the Emerald City…), what should they do if they’re interested in exploring what THD lens could do to improve their organization’s performance analytics?
Chris: I’ve got just the destination for you, Jamie. Get more details by visiting our dedicated THD lens homepage and then click the link to request a demo. I’d love to take you on your very own customized tour of our dashboards. 😊


