

What if I told you that you may be looking at your web analytics all wrong? What if what you see when you log in to Google Analytics was a big, fat data lie? What if Tom Brady had stayed with the Patriots? I can help you with exactly two of those questions. It all comes down to attribution and a dirty little habit called “last click.” Come closer and hear my (tongue-in-cheek) cautionary tale ...
First, let’s get some background. So, what is attribution and why do you need to understand it?
Attribution is giving proper credit to a user’s behavior at a marketing touchpoint. A “touchpoint” is marketing speak for things like a PPC ad click, clicking through on an email link, seeing a display ad, clicking an organic search link, visiting a site by typing in the URL, etc. You get the picture.
Correctly attributing credit to your marketing efforts is essential to optimizing performance and reducing waste. As people have been spending more and more time on various online channels using multiple screens and devices, the donor journey has gotten pretty convoluted, leaving us marketers struggling to find a reliable method for measuring activity across media channels. For today’s digital marketing programs to perform optimally, it is critical to use an attribution model that fits how your customers or donors interact with your marketing messages.
When done right, it’s the secret sauce to maximizing revenue from your marketing efforts. Done poorly — or worse, not at all — it will leave you in the dark; almost certainly wasting time, effort, and money. And nobody wants that, right?
Let’s start by learning more about the most common types of attribution models and why most of them aren’t so great. There are many more than what we’ll cover in today’s post, but if you’re new to attribution models, these are some of the most common ones you’ll see. The good news is that there is an ideal attribution model for you and your audience. The not-as-good news is that there are no one-size-fits-all attribution models, so there will be some trial and error to find your right fit. That’s the inherent flaw in most of these models. And a quick hint: Beware of the model that seems too easy.
Last-Click Attribution

The first up is “last click.” This is the out-of-the-box model that almost every web analytics* software uses. Last click means credit is only given to the last interaction before a conversion — regardless of what happened before it. This is like only reading the ending of a book — you miss the whole story that leads up to it. Seems a little shortsighted, right? How did the user learn about your organization? What prompted them to find out more? What if my user had ten interactions with my marketing before clicking that branded, low-funnel PPC ad? Shouldn’t those actions get some credit? Yes. Yes they should.
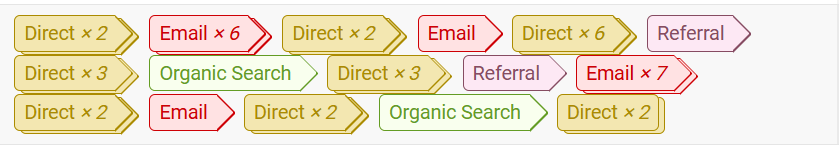
Figure 1. This image shows a path to conversion with over 70 interactions. This is atypical but illustrative of how many interactions happen before the last click.
Last click is an easy (see, I told you) method for seeing only the last part of the journey. Can it work? Sure, but you could make critical errors by making all your investment decisions based on last click. I think my favorite data junkie Avinash Kaushik said it best: “The only use for last-click attribution now is to get you fired. Avoid it.” If you are a last-click junkie, fear not — there is a better way. But that way is definitely not ...
*Note: Google Analytics uses “last non-direct click” by default. This is weird and causes confusion, so I’m only covering true last click in this post.
First-Click Attribution

First click is last click’s evil twin. Both are single-touch models and should be avoided at all costs. First click, as you may have surmised from its catchy name, gives 100 percent credit to the first interaction and flat out ignores anything that happens after it. First-touch attribution would be like saying that the first car I ever bought (a 1981 Corolla I named “The Wedge”) gets the full credit for my purchase of my current car, a Jeep Grand Cherokee (called “Jake,” of course).

Figure 2. Should we give 100% credit to the PPC ad when social media was the closer? Nope. And what about the SEO search in the middle? It deserves some credit too.
Linear Attribution

There has to be a better way, you’re probably saying to the marketing gods right now. Well, there is. And it’s light-years ahead of those first two single-touch models. It’s called linear attribution, and it gets you in the game.
Think of linear attribution as that coach that gave you a trophy for being a player on the winning team, even though you didn’t score yourself. Participation counts. Even for you, Rudy. So here, every touch gets equal credit across the board, regardless of how many touchpoints there are. Now that we’re actually looking at all the touchpoints, you can see the whole picture. Equal credit though? Probably not. If only there was another method that let us build credit over time? Spoiler alert: It’s called time decay.
Time Decay Attribution

Time decay weights interactions more heavily the closer they get to the conversion event. So, the first interaction has the lowest credit and the last one has the highest. Now we’re starting to see some cause and effect! Are we seeing lots of social interactions just before conversion? Or display views? Or email clicks? What if we test heavying up on the email since we know it’s a good closer? Does that affect revenue positively? Why don’t you go test it? Let me know how it goes!
Position-Based (or U-Shaped Attribution)

What if I have a lot of PR and broadcast in play right now and I want to give higher credit somehow to the first interaction — but not all the credit? Well, my friend, that’s why we have (one of my faves) the U-shaped attribution.
With U-shaped, the first and last touchpoints share equal (and higher) credit than anything else. The remaining 20% gets divvied up between the rest of the interactions. This model is the easiest of the “better” methods to use right away and get bang for your buck. It also feels intuitive, somehow. You can get behind a model that says the introducer should get a lot of the credit. We spent time and money on ads or SEO (or whatever that touch is), and it starts the journey. I can believe in that. Feels good. But, I also know that the last touch — the closer — should also be important — because it sealed the deal and got the conversion. But, there has to be more, you may be saying to yourself right now.
Custom Attribution
Well friends, the final model takes the best of the two “better” models (time decay and U-shaped) and allows you to fully customize the model based on your users’ behavior. So you can look at click paths, conversion windows, and multi-channel funnels and build a working model. Then you have to test it. I’ll explore how to set up these custom models and tests in Google Analytics in a future post. The basics are looking at your organization and getting a bead on how long the path to conversion is, what channels (online and offline) are in-market, and new vs. existing user behavior. So how do you do that?
Using Multi-Channel Funnels Views
Google Analytics has an awesome feature called MCF (or Multi-Channel Funnels) grouping. It has a very cool visualizer that allows you to see the interaction of up to 4 channels at once. In the image below, we can see the overlap (combinations of conversion paths) between direct, organic search, paid search, and referral. So for example, in the image below, there’s a lot of overlap, so you can see that a pretty large percentage of conversion paths contained 2 or more channels.
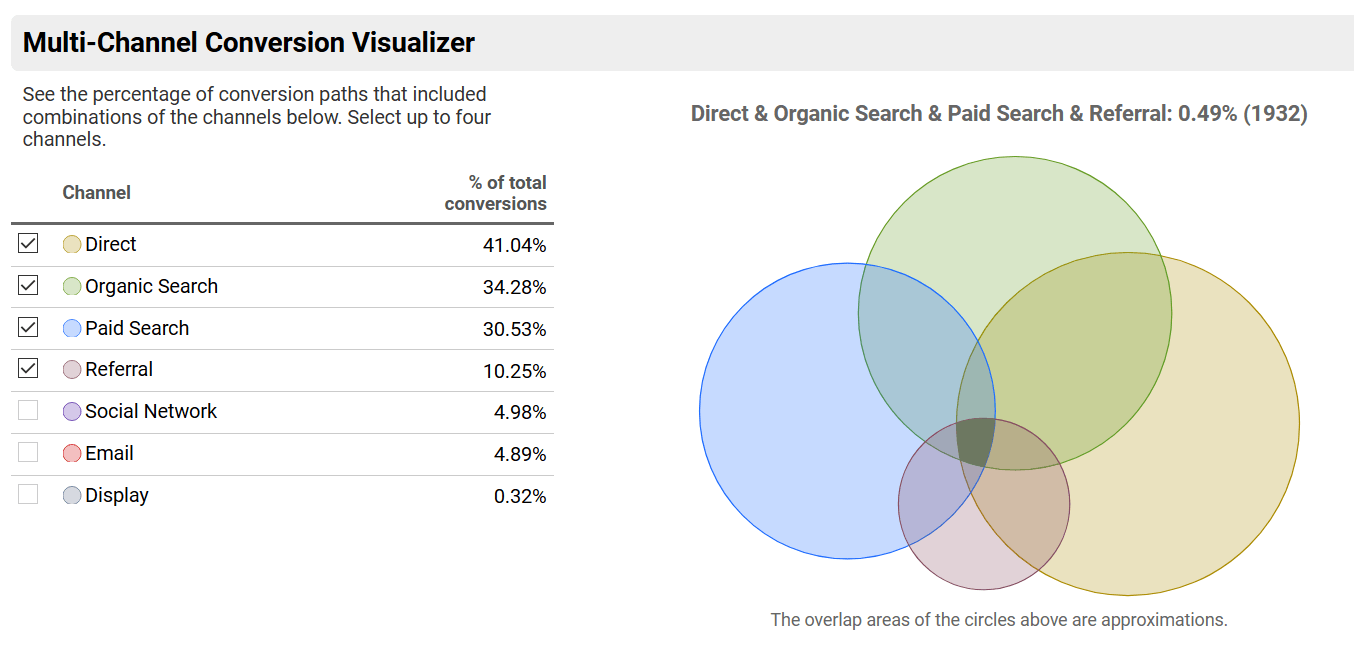
Figure 3. This image shows the percentage of conversions that contained the listed channel. For example: This shows that 34% of conversion on the website contained at least one organic search and 30% contained at least one PPC ad click.
The next view is of the MCF grouping and the difference in assists vs. last interaction (last click). This shows how many times a given channel was a touch in the conversion path vs. how many times it was the last touch before a person converted. In the last column, when the number is lower than 1, that means it’s most often the last touch before conversion, whereas a number higher than one means it’s mostly an introduction or assisting channel along the path to conversion. The closer the number is to 1 means that channel is equally important along the journey and for driving conversions.
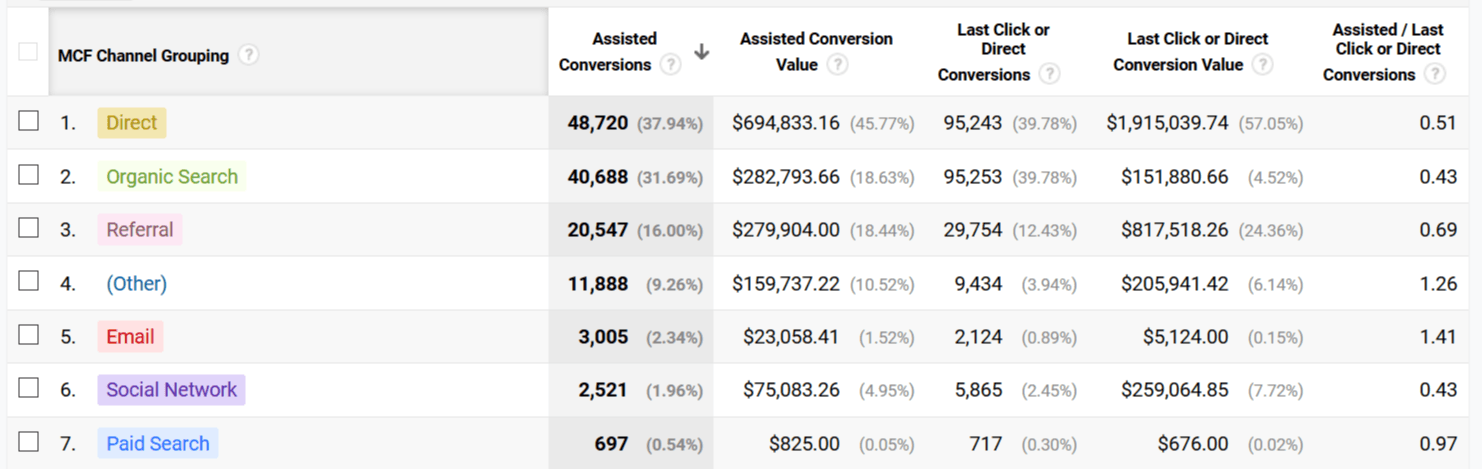
Figure 4. This image shows the Multi-Channel Funnel from Google Analytics. Here, you can see which channels have more value as a “last click” or as an “assist” for an eventual conversion. A number greater than 1 in the last column means this channel has a tendency to assist in conversions more than being the last touch. This means if you’re only looking at last –click, then these channels are devalued and you can’t see their true revenue contribution.
Using the Attribution Modeling Comparison Tool
Now that we know about some of the most common (“better” and “not-so-good”) attribution models, how do we start to make decisions on which model to use? Google has a model comparison tool that allows you to do just that. In the figure below, I’ve pitted last click up with time decay. Here, we can see that in last click, direct is getting credit for way more than it should, but when we look at time decay, we can see that several other channels are actually contributing and should be up for investment consideration. Take a look at display. The green arrow means we need to ramp up our spend. This shows that 12% more conversions are happening through display than would have been reported on last click (and attributed to direct).
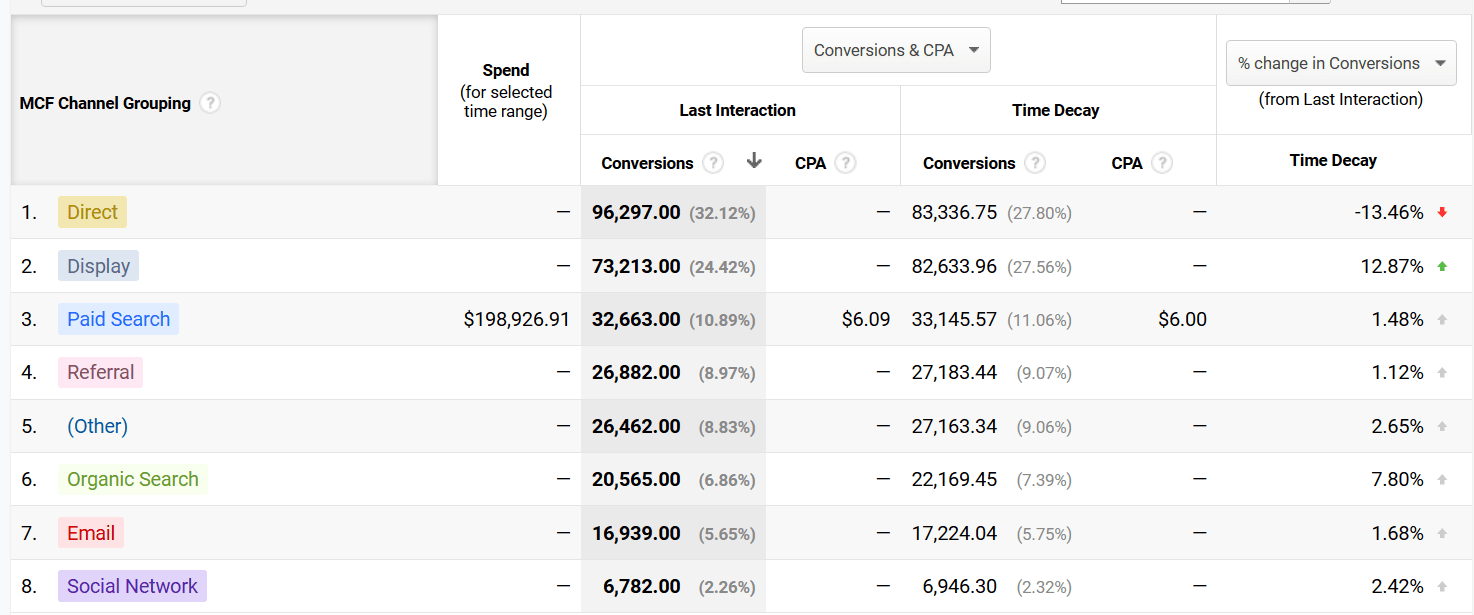
Figure 5. This image shows the model comparison tool comparing last click to time decay.
So there you have it. (And thanks for letting me indulge by poking a little fun!) The reality is, there are still a lot of programs that are being measured by last click. Maybe that’s you. Maybe you inherited it or you have a system that is only set up for last click. It’s okay. Really. It’s not the end of the world, but I hope you can see that there are other ways to make investment decisions on your marketing programs. If you haven’t explored GA’s free Multi-Channel Funnels or their attribution model comparison tool, I would suggest you give them a go today. If you have any questions on what we’ve presented today, leave us a comment here. Do you have a favorite attribution model? Stay tuned for more in this attribution series!
