

Hi! I'm Chris Hubbard. In my role as Vice President of Data Strategy at THD, I'm responsible for ensuring that our clients’ data is fully utilized to drive revenue.
Our point of view on data at THD is that it’s not enough to just collect lots of donor and giving data. That data needs to be accessible and presented in a way that facilitates insight discovery and action.
You know as well as I do that there’s more data available to us now, in 2020, than we know what to do with. Analysis paralysis is real; I see it every day. But have no fear, the THD data nerds are here to help!
With so much volatility in this COVID era, you need to see the metrics that matter, spot key trends, contextualize performance, and identify actionable insights — all with a goal of finding innovative solutions to the challenges you and your team are facing in the here and now.
So, let’s go there! Let’s dive in by looking at some performance trends that matter to you in the here and now by interrogating revenue and engagement trends since COVID-19 hit.
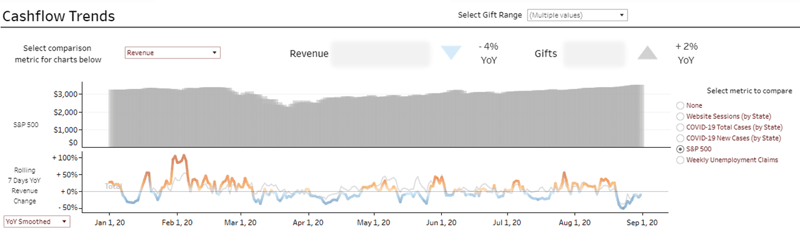
The following view from our custom business intelligence dashboards, which we affectionately call THD lens, shows revenue trends (the line graph at the bottom) plotted against the new COVID-19 cases (the top bar graph):
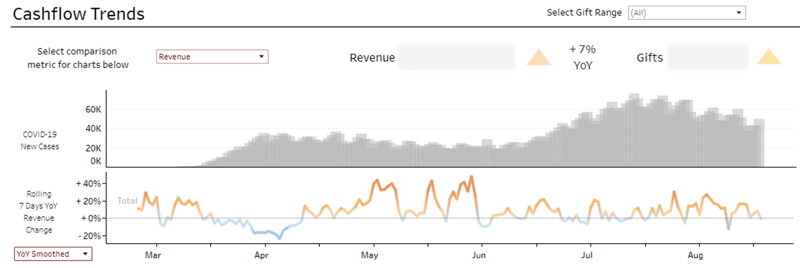
>>> Want to see more of THD lens? Click here!
In this view, the initial immediate revenue drop in mid-March is evident before a strong rebound from mid-April into June. This was followed by another relatively soft period as COVID-19 cases spiked again in July, but on the backslope of the second peak, we see steeper YOY growth yet again. Coincidence? I think not!
Okay, so you probably already know that there was a drop when COVID-19 cases first skyrocketed — duh! And you know that worst-case scenarios did not manifest for most organizations — at least when it came to direct marketing. (Event performance is a story still being written.)
But what have the most recent three months looked like?
While there are many sector-specific influences and some outlier organizations, our internal benchmarking has shown widespread YOY revenue growth across our client base — with almost all organizations showing strong YOY growth since March 1. In the most recent three months, the median revenue increase has been 11% — even higher than what we saw during the late spring.
The growth in digital revenue has been more pronounced, with a 32% median increase in this same period. With large-scale fundraising events shifting to virtual and changes in consumer behavior brought on via lockdowns and quarantines, direct marketing digital revenue growth has soared. Mail sources have also shown a median increase, just not to the scale seen with digital sources.
Check out this graph benchmarking digital revenue against web sessions:
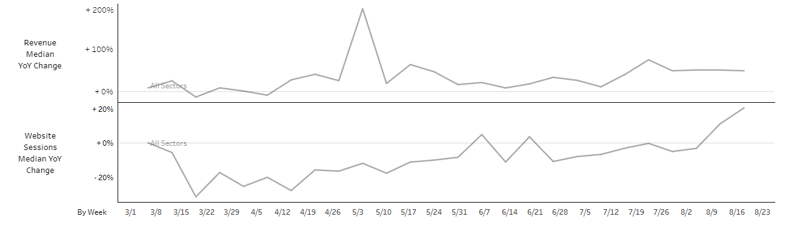
While online revenue has soared for our clients, median website sessions have only just recently returned to a level near or above last summer. With conservative budgets enacted, given the potential negative effects of the virus, lower spending on events and brand marketing may be contributing to fewer website visits. The Good News: those who are engaging seem more intent to donate than ever, with an increase in revenue per session.
So, if external circumstances like the pandemic can shape our trends, it’s worth noting that Mother Nature has not exactly been nurturing this summer — massive wildfires, hurricanes, and floods have threatened various regions of the country over the last several months. Is this having an effect on performance?
In the broadest sense, during the summer, we did not really see a decline in regions hard-hit by disasters. Using California, Oregon, and Louisiana (states that recently suffered high-profile disasters), the lowest performing state (Oregon) still showed flat YOY median revenue growth.
However, a sector-specific lens shows a change in the types of organizations donors are contributing to. Human Service and International Relief organizations are seeing strong gains in these geographies. This makes sense, as organizations in these sectors may be actively assisting those who have been personally affected by the catastrophes. Neighbors helping neighbors.
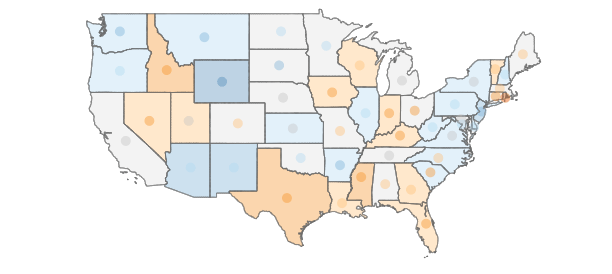
On the other hand, health organizations (shown below by state) are showing an aggregate 1% decline across these three states, with California and Oregon down more substantially. As we’ve seen before, donations to health charities can take a temporary back seat when pressing, urgent events arise. It’s worth noting that these sector pendulum swings usually right size themselves over time. This could be a good thing for health organizations as we enter Q4 with some delayed giving now due! Let’s hope at least… though, let’s be clear, hope is not a strategy. What you can do is make sure you’re delivering relevant messages. Everyone’s had a tough year — some more than others — don’t be afraid to acknowledge it.
Health sector by region (June-August)
When the market crashed in March, we saw a large drop in the number of high-value donors contributing to several organizations. With the S&P 500 mostly on an upward trajectory since that point, have we seen an uptick in giving from high-value donors?
In this example, after a strong start to the year for high-value donors, we see the large drop in performance (bottom half of chart) in mid-March as the S&P 500 (top half of chart) fell precipitously with the onset of the pandemic. $250+ segments had a steeper decline than the overall file (depicted by the light grey line). While the revenue recovery for the overall file was quick, the $250+ segments lagged through mid-July.
The market has been less volatile in July and August, and the $250+ segments have had a more sustained rebound. Volatility in the market has a greater effect on high-value donors — something we have seen consistently during times of economic crisis. While 2020 has been a crazy year thus far, it could still get crazier (not that a run-of-the-mill election could have anything to do with it). Make sure you are staying in front of your high-value donors and reiterating the impact of their ongoing support.
There are so many things to explore with so many overlapping influences in this pandemic era. If there’s something you’re interested in, feel free to drop me a note. I’ll be in the data playground and am always happy to share our sandbox!
Happy data wrangling.
